|
Let me quickly go through statistics data on Azerbaijan residential property market. However, I myself never make property investment because (i) there is a currency depreciation risk, and (ii) decent price trend data is unavailable. Population and Household Number of households grows by faster pace than population growth. Azerbaijan has 9.8mn population with 1.2% annual growth from 2010. The population is expected to reach 11.8mn (+20%) at 2050.  Average household size is under declining trend due to urbanization / decreasing birth rate / diversification of life style, etc. 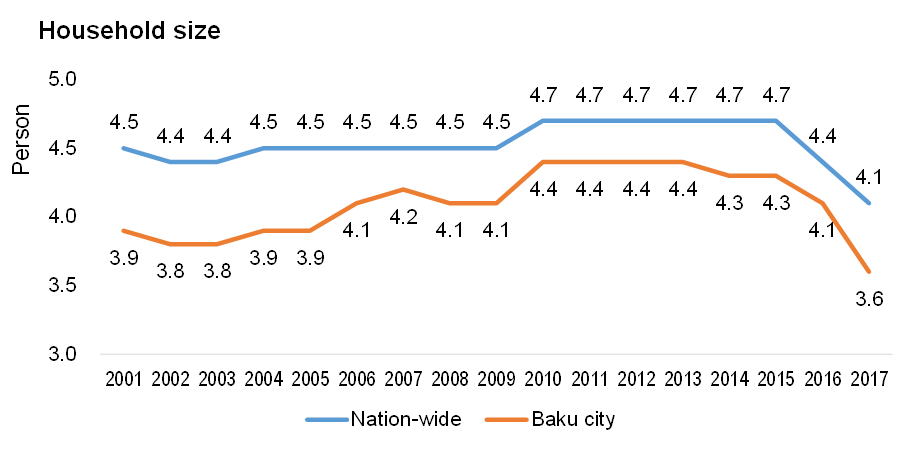 So, if above Household size data is correct one, number of household should be under rapid hike. Let’s compute it from above 2 charts. 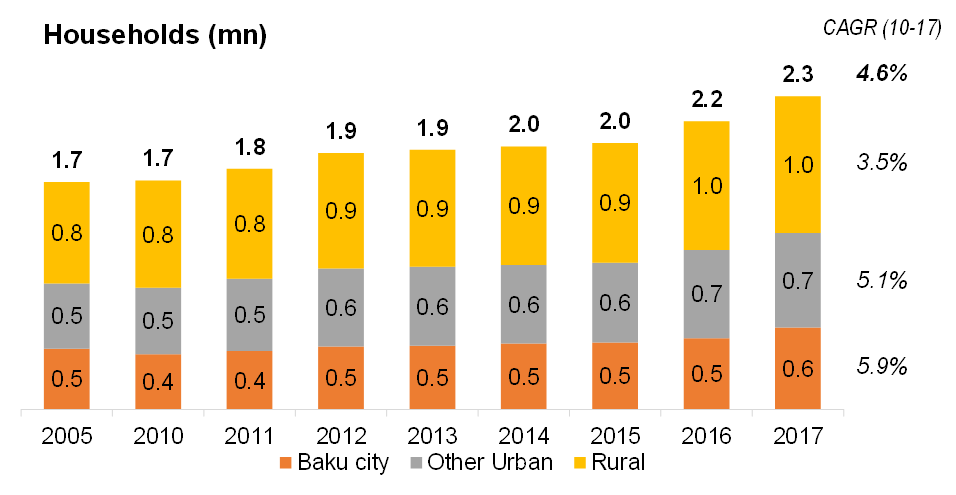 Number of Households has recorded 4.6% annual growth after 2010. In Baku, it the growth rate is 5.9%. Not sure the rapid change in Household size data is correct one, but I think there is an obvious trend that number of Households are increasing under faster pace than population growth, as a result of diversification of life style, etc. You know, traditional life style in Azerbaijan is that children reside at home till their marriage at early 20s, and they never divorce once married. On the other hand, especially in urban area, you can see young guys sharing room, mid-aged single men/women or divorced men/women, they reside separately from their family. These diversification of life style should be the reason of increasing household numbers. Dwellings Stock Modest 1.0% annual growth from 2010. OK, let’s have a look at dwellings stock in below chart. Note that this number does not include dwellings in hostels. Dwellings stock has recorded 1.0% annual growth and reached 2.0mn at 2017. 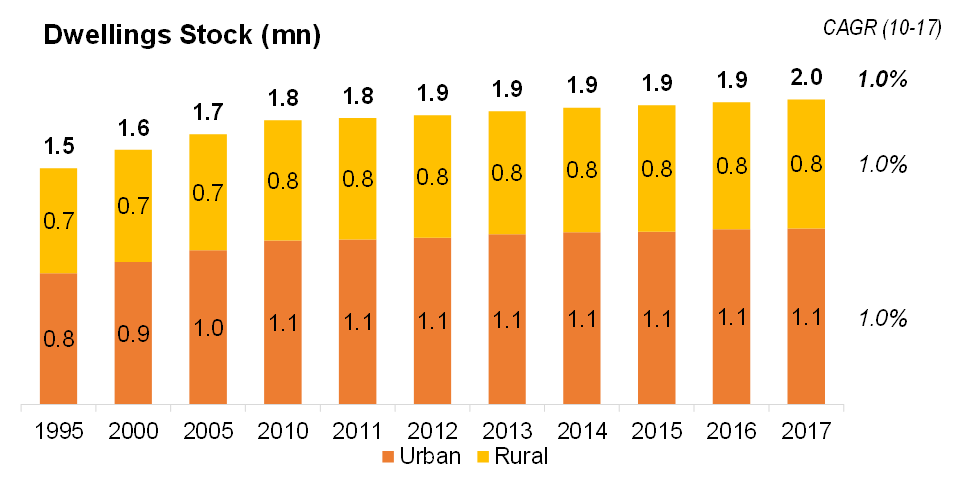 Till 2015, dwellings stock is almost same as households number, but in 2017 when households number rapidly hiked to 2.3mn, Dwellings stock was just 2.0mn. How can I explain the 0.3mn gap? Someone may stay at hostels/hotels, but the total room supply of hotels/hostels is just c.20,000, so it is not enough to explain 0.3mn gap. Perhaps, some dwellings are registered as commercial property or not appropriately registered. And guess young guys may use room sharing. Anyway, dwelling stocks supply may be tight. Construction c.15,000-16,000 annual introduction of new dwellings. Average area of new dwellings is under increasing trend. Annual introduction of new dwellings peaked at 2012-13 with c.20,000+ p.a., followed by declining/stabilizing phase. Average area of new dwellings is under increasing trend. 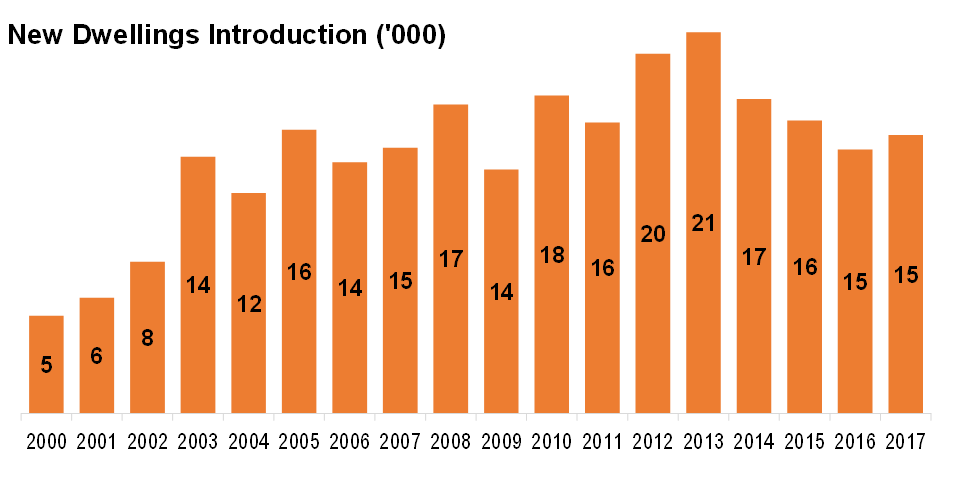 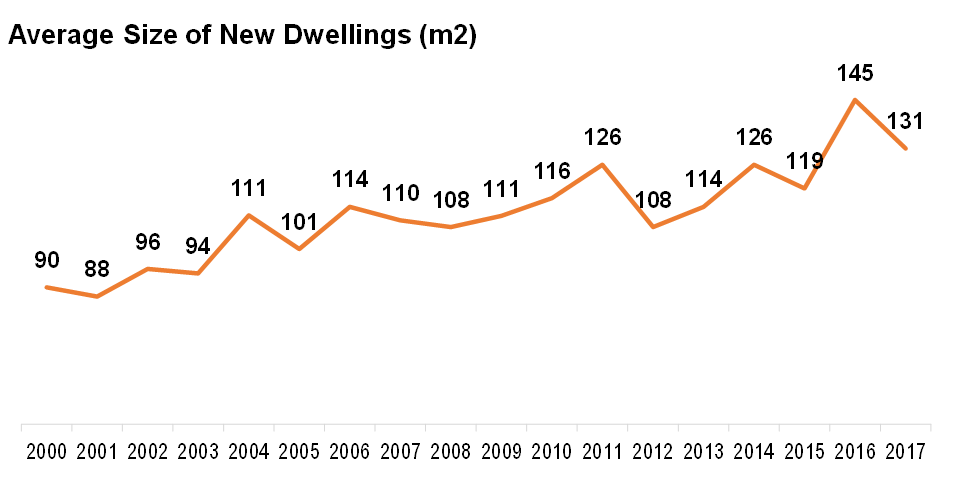 Property Transaction House/apartment registration shows strong growth in 2018 and is expected to reach c.100k level in 2018, especially thanks to strong momentum in apartment sector. Below chart shows registration of house and apartment. Assume this number is linked to number of property transactions. (Of course, there should be noise data included e.g. inheritance.) The property registration had a declining phase through 2015-16, but entered into recovery phase from 2017, when 90k registration was held. In 1H2018, further growth was observed in apartment segment (+18% v.s. 1H2017). I suspect annual property registration will be c.100k record-high level in 2018, thanks to the strong momentum in apartment segment. 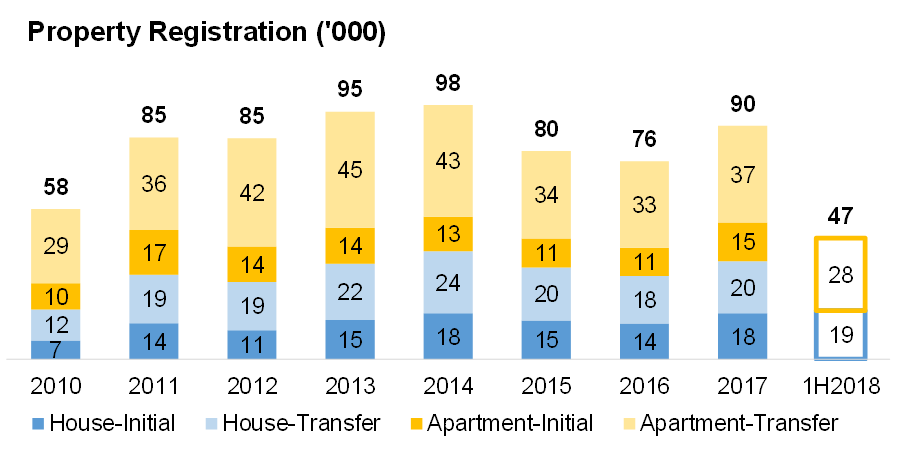 Annual initial registration of house / apartment is c.30k, which is almost double of new introduction of dwellings stocks from Construction statistics… Not sure how this happens… House occupies more than half of initial registration. 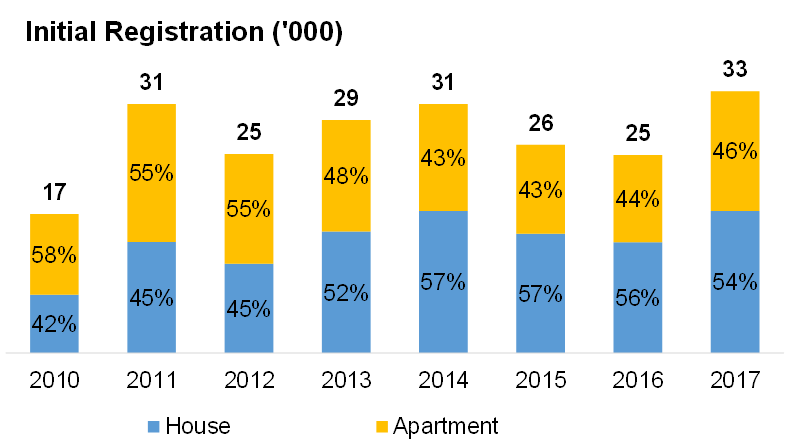 Mortgage AMF loan is dominating mortgage loan balance. Major borrowers are young male working in public sector in Baku and looking for apartment with AZN 30,000-60,000 price. Mortgage loan balance is AZN c.1.8bn as at 2Q 2018 and being stabilized from 2016. As Azerbaijan Mortgage Fund (AMF) provides lower interest loan, contribution from AMF is rapidly increasing and reached AZN 1.0bn or 59% of total loan balance at 2Q 2018. 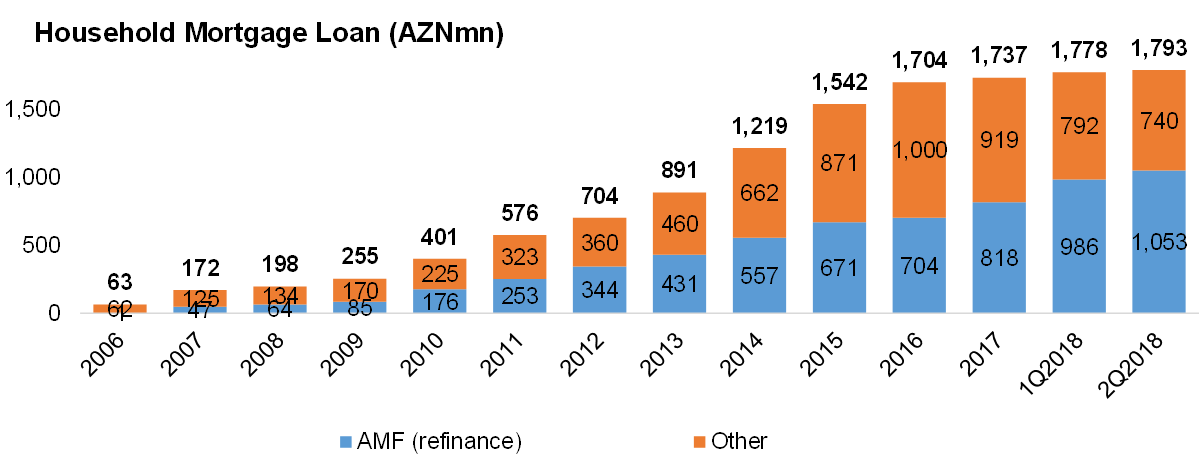 Number of borrowers of AMF loan is just c.23k as at 2Q 2108. Borrowers of AMF loan have increased c.5k after 2015, i.e. pretty modest growth compared to property registrations in market (c.70-90k p.a.). Suspect (i) cash transactions without mortgage are active, and (ii) transactions between AMF borrowers are active, i.e. borrower number is unchanged. 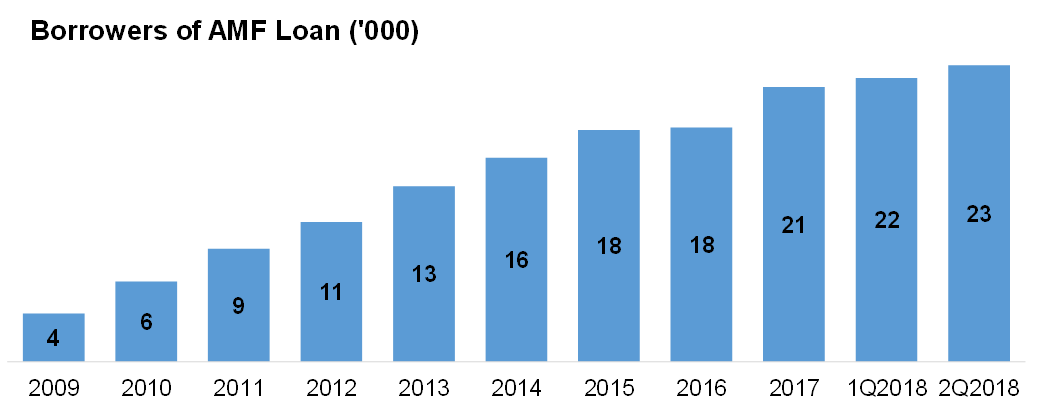 76% of AMF loan borrowers are concentrated in Baku. 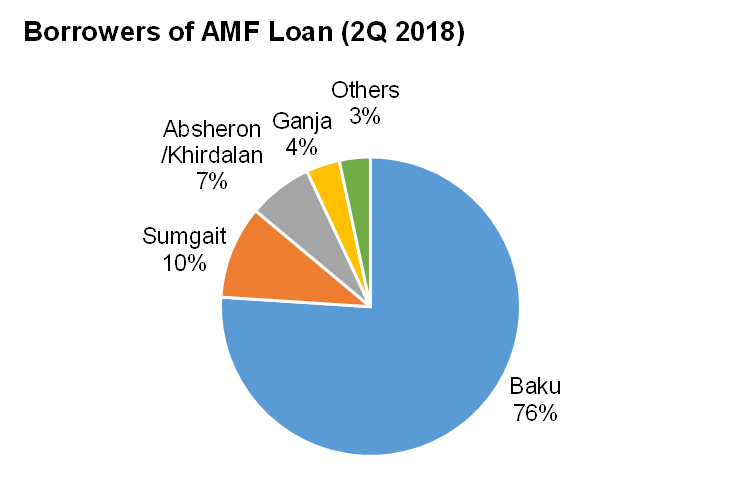 Borrowers’ profile is available on AMF loan. 53% single, 83% Male, 49% working for public sector and 70% less than 35 years old. Young Male working for state-owned companies / government utilize AMF loan for coming marriage or investment purpose. 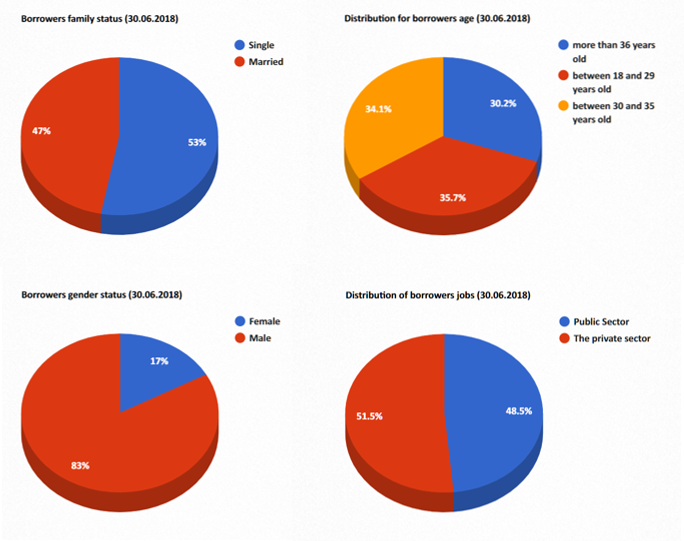 Collateral info is also available for AMF loan. 94% apartment, 40-80m2 size occupies 64% and AZN 30,000-60,000 value zone occupies 73%. 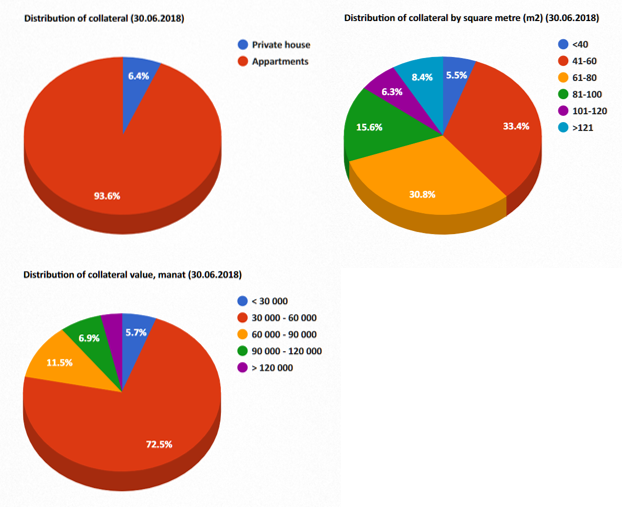 Regarding Baku, regional breakdown is available for AMF loan. Top 3 districts are Khatai (25%), Yasamal (16%) and Binagadi (14%). 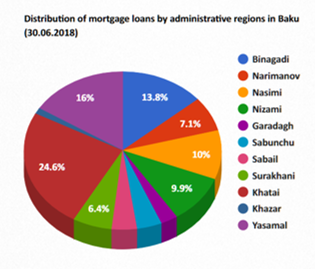 Property Price Decent data is unavailable... Price info is pretty limited. This is the reason why I never make investment in Real Estate. Some news articles mentions price info. (https://www.azernews.az/business/138373.html) Or, property appraisers have a data, which can be provided on fee basis, if you want.
4 Comments
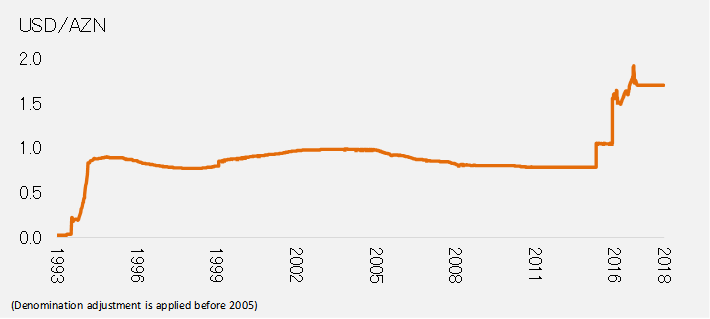 Azerbaijani Manat (AZN) depreciated more than 100% for the past 3 years. In this column, I want to quickly have a look at Azerbaijan's economic situation and have an outlook for Manat exchange rate. Any comment / insight from you is appreciated. Note that info disclosure is limited in this country, thus some analysis may not have enough granularity and some key economic indicators may be missing. CONCLUSION
POPULATION Demographic bonus is expected for coming decades Population in Azerbaijan has recorded robust growth for the past decades and reached to 9.8mn at 2017. Total fertility rate (TFR) is under declining trend, but still keeps 1.9 as at 2017. Given the higher ratio of young generations, this country is expected to have further population growth to 11.8mn (+20%) at 2050. 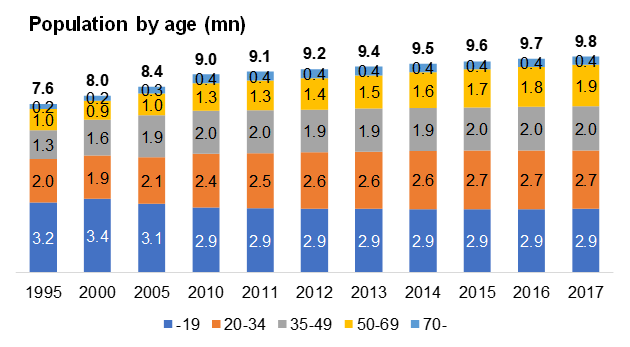 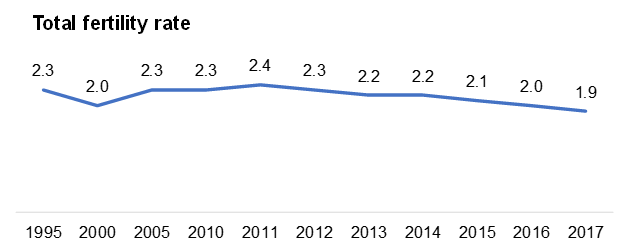 From 2010 to 2017, population recorded 1.2% CAGR growth. In Baku / other urban area the growth was 1.2% and in rural area the growth was 1.3%. I suspect organic population growth is slowing down in Baku / urban area, however population inflow from rural area offsets the decline. As a result, nation-wide balanced population growth has been achieved 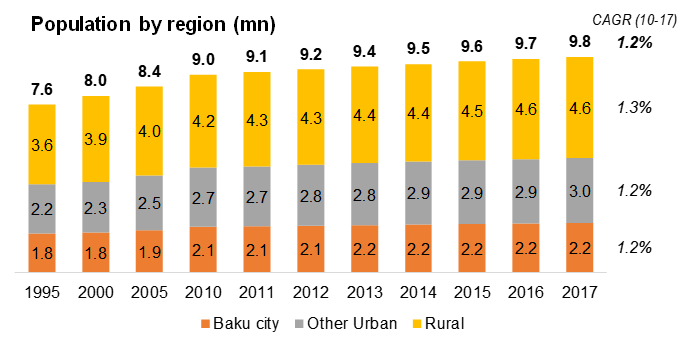 GDP Inflation is the driver of nominal GDP growth... Net export is the decisive factor of economic condition. Azerbaijan's GDP has 2 faces, robust growth on AZN base vs. drastic shrinkage on USD base after 2014, due to AZN depreciation. 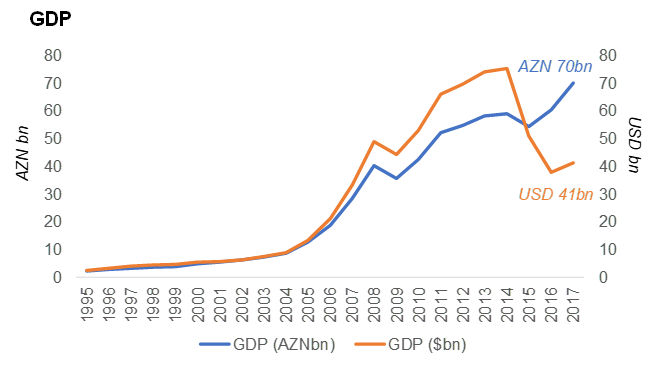 The State Statistical Committee publishes growth rate of GDP. Looks like this number is actual GDP change net of inflation impact (orange line in below chart). For the past 2 years, Actual GDP recorded negative growth, despite 10%+ growth of Nominal GDP (blue line). On that period, consumer price recorded 10%+ inflation (gray line). Recent strong growth in AZN-base GDP is just a result of inflation, rather than intrinsic economic growth. Detail is explained at Trade section, but this inflation is an imported inflation due to imported goods price hike caused by AZN depreciation. 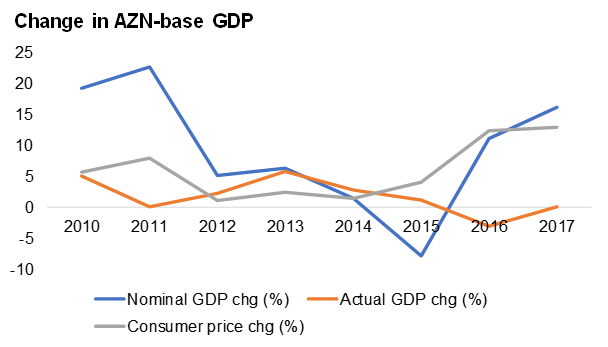 Mining sector’s contribution to GDP was 45.6% at 2010. The ratio declined to 26.4% at 2015 due to oil price slump. Robust growth was achieved in Trade sector. Construction sector peaked at 2014, but still keeps c.10% contribution. Led by construction activity and housing bubble, Real Estate sector has had robust growth. Still small contribution of just 2%+, but Accommodation / Food sector enjoys rapid growth with 20.6% CAGR. Eased visa conditions and depreciated currency attract tourists especially from Arabic and CIS countries. Note that tourism from Arabic country has sex tourism aspect. 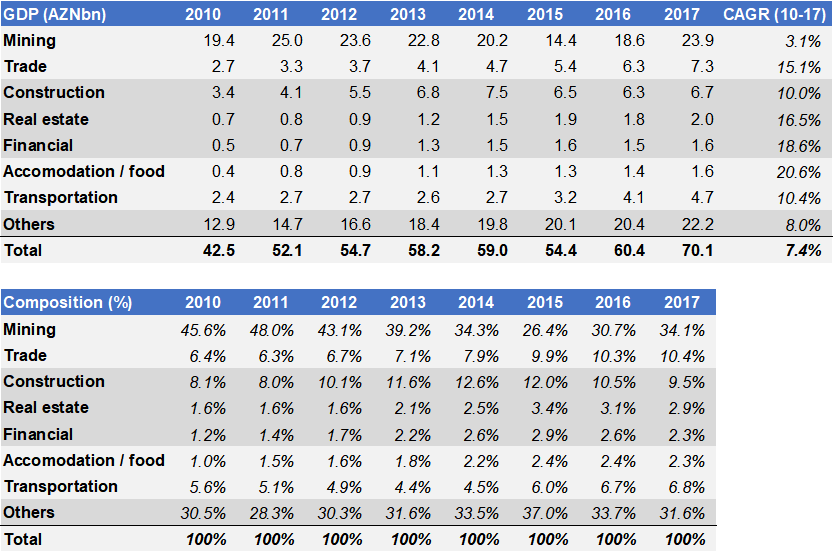 Among GDP items, Export occupies AZN34bn, i.e. 49% of GDP in 2017. This ratio was 56%! at 2011 before oil price slump. 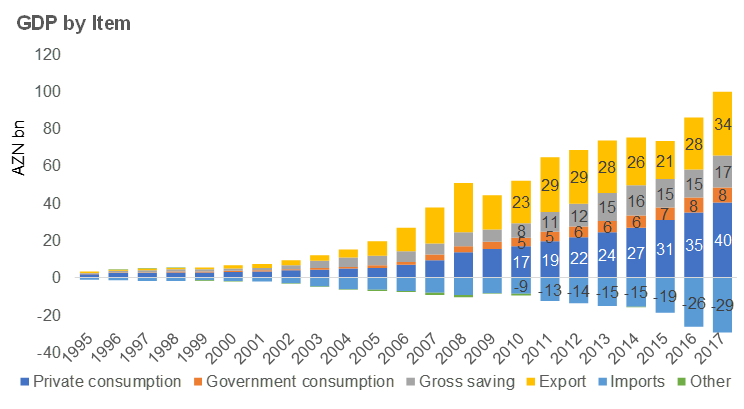 Azerbaijan’s economy extremely depends on export, and fluctuation of export is the decisive factor of economic status, since other GDP items have stable growing trend. Net export (export minus import) and Actual GDP change shows correlation. 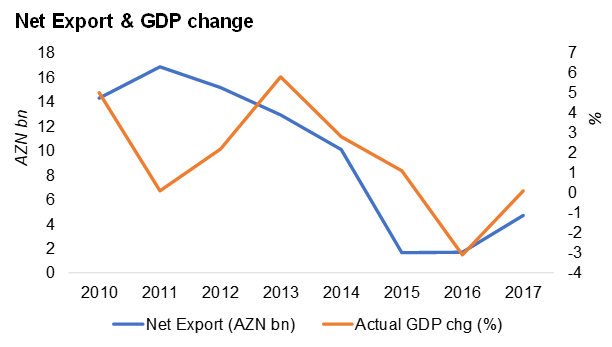 TRADE Azerbaijan economy extremely relies on oil export. Oil price slump made crude oil export value in 2015-17 almost half compared to 2014. On the other hand, import has increased especially after 2011. AZN depreciation caused rapid hike of CPI due to imported inflation. Export data from trade statistics shows discrepancy vs. national accounts data. Also the oil-related numbers are different vs. data from state oil companies. Following analysis is done based on trade statistics. Upon beginning of operation of BTC pipeline at 2005, export of oil / fuel has rapidly increased and occupied 90%+ portion of total export.  On import side, main import items are machinery, food, metal and chemicals. Machinery occupies largest portion but the amount is under decreasing trend. Detailed breakdown of Machinery import is unknown, but looks like items that ocupy significant portion are heavy machinery (boiler, turbin, pumps, construction machinery, etc.) 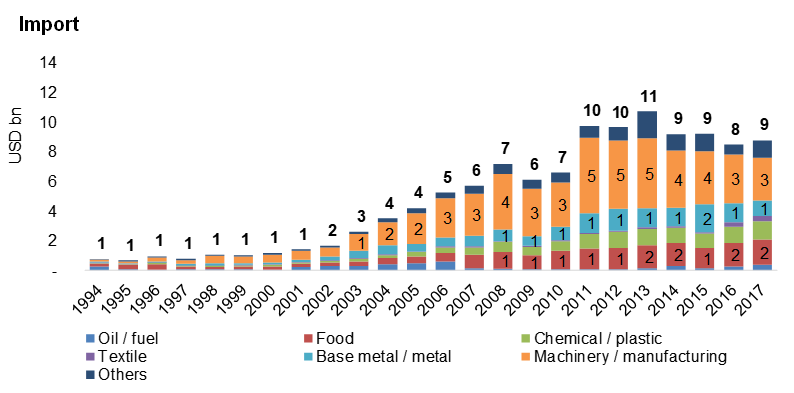 Let’s have a look at oil / gas export a bit more. Following charts show Crude Oil export volume, value and price. Export volume moves around 22-34 Mn tones in 2009-2017. Considering BTC Pipeline’s throughput capacity of c.50 Mn ton p.a., there still be some upside margin for volume. Export price enjoyed some premium vs. WTI till 2014, but now it was declined to almost WTI price level in 2016-17 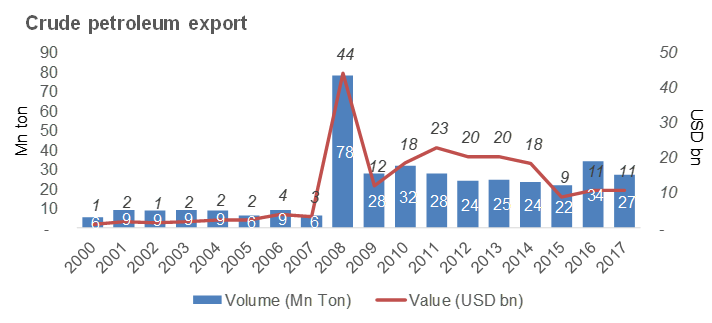 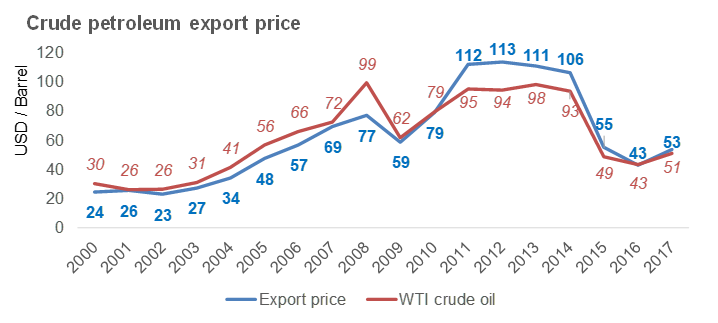 Smaller than Crude Oil, but export of Natural Gas is also confirmed from trade statistics after 2006. Natural Gas is exported mainly to Georgia and Turkey through BTE pipeline. The pipeline has capacity of 20bn m3 p.a. Export price shows premium vs. Henry Hub price. 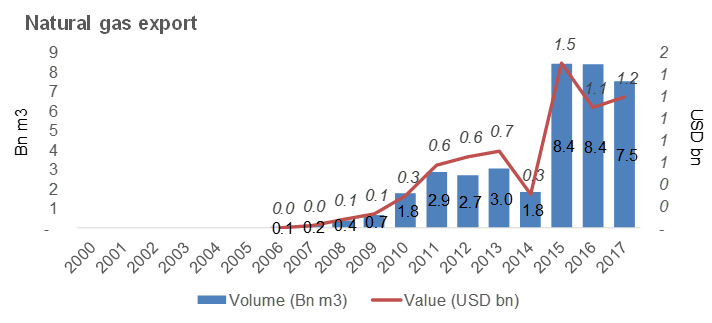 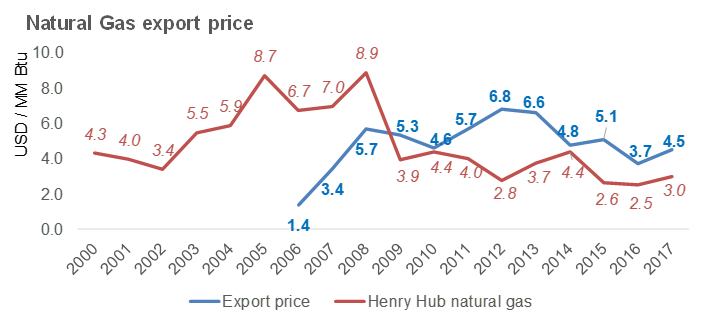 By the way, someone claims that the Manat depreciation (main topic of this column) had an aspect of bailout of export industry. Non-oil exports are largely directed to Russia, so when Russian Ruble is depreciated, Manat is also depreciated to secure competitive export price to Russian market, they claim. Following chart of USD/AZN and USD/RUB exchange rate shows correlation. Yes, the depreciation may have had an bailout aspect, however I don’t believe it was a crucial factor. 90%+ of export is oil & gas, on which price is decided by market and settlement is done by USD, I mean depreciating Manat has minimal impact on oil & gas export. Non-oil export portion was benefited by AZN depreciation, but the amount is just USD 1-2bn. So influence to economy is minimal. While import amount is USD8-11bn, and this portion is damaged by AZN depreciation. For saving small non-oil export industry, sacrificing import price, i.e. people’s life, is not a logical solution. Perhaps, Russia also depends on natural resources export, thus vulnerable to commodity price. So, RUB is depreciated at the same timing with Manat’s depreciation. 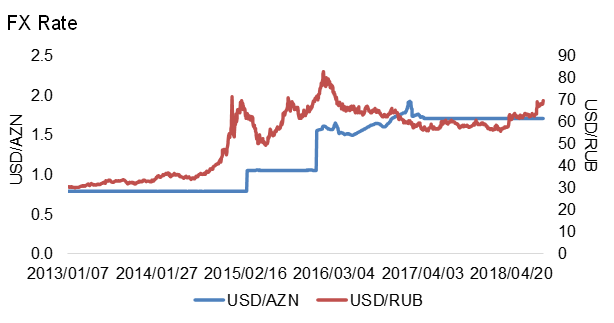 That point is rather near-future topic. Turkey and Russia, major export destinations from Azerbaijan, experiences steep currency depreciation in 2018. This should cause trouble to Azerbaijani non-oil export industry. For the purpose of bailout for non-oil export industry, small-scale depreciation might be held. (Or subsidy should be an alternative solution). Please see Bloomberg article for more detail. (https://www.bloomberg.com/news/articles/2018-08-09/quandary-on-the-caspian-as-sanctioned-neighbors-rattle-azeri-peg) 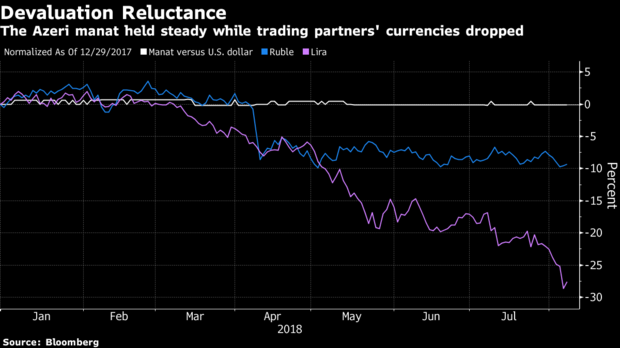 Let’s have a look at how Manat depreciation influenced consumer price, i.e. people’s life. Following chart describes USD/AZN rate and Consumer Price Index (2010=100) relations. Until 2015, CPI moved in stable 110-120 range, followed by rapid hikes at the depreciation timings, as if CPI traces USD/AZN exchange rate change. This is Imported inflation. Azerbaijan heavily relies on imported products from daily consumer goods to mechanical equipment. Manat depreciation immediately affected consumer price as shown in the chart. The rapid inflation is now entering into stabilizing phase in 2018. 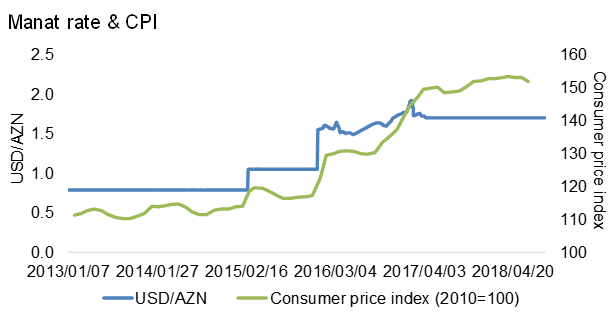 BALANCE OF PAYMENT Non-oil Current Account was always in huge negative range of USD -5~10bn. Declined oil export from 2015 made total Current Account negative. Capital flight toward outside Azerbaijan and reduction of CBAR’s reserve were observed in that period. Let’s have a look at Azerbaijan’s international money flow comprehensively. Following chart is summary of Balance of Payments. 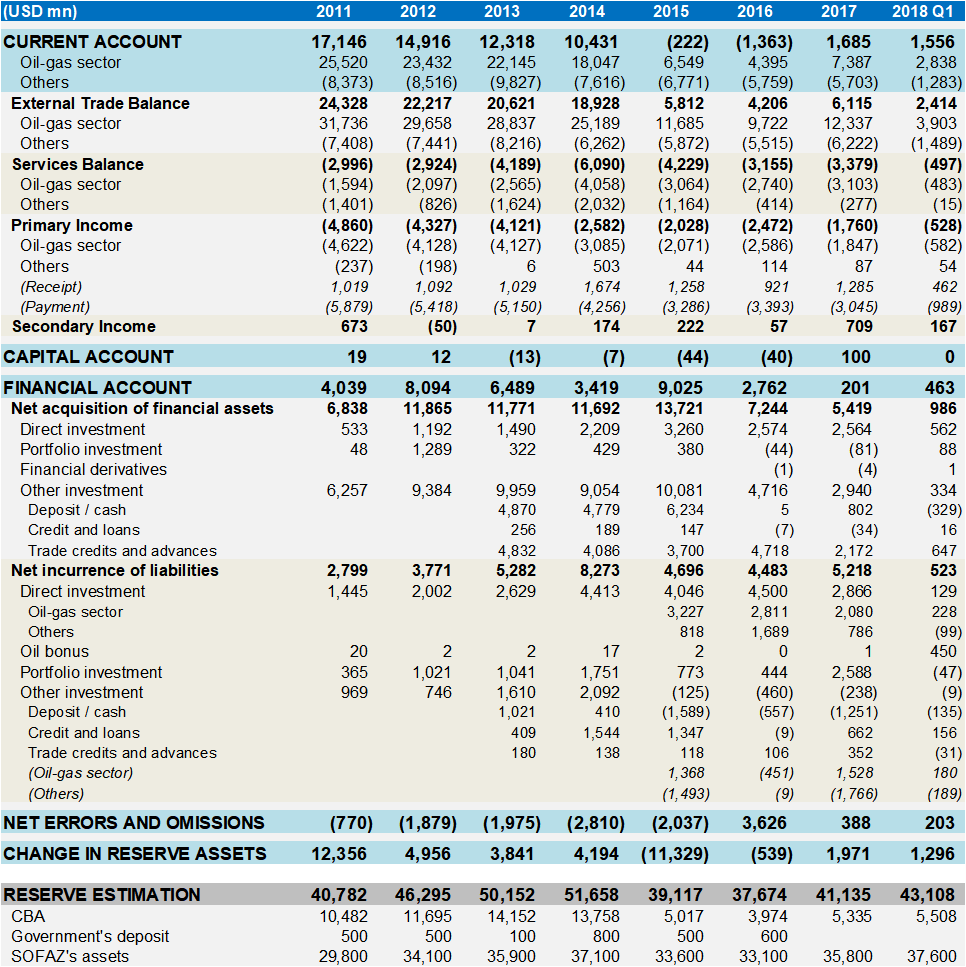 Current Account is vulnerable to oil price slump, as Non-oil Trade Balance, Service Balance and Primary Income are always in negative range. Sum of non-oil Current Account is USD -8~10bn in 2011-14, and USD -5~7bn in 2015-17 (Manat depreciation timing). In 2015-17, oil / gas export amount was USD c.10~12bn, i.e. break-even or negative Current Account range. Rapid decline of Current Account should have raised concern on economy, Manat stability or debt service capability. You can see foreign investors’ movement in liabilities side of Financial Account. Cash outflow of Deposit / Cash is confirmed in 2015 (USD 1,589mn), 2016 (USD 557mn) and 2017 (USD 1,251mn). This is critical amount, as foreign currency deposit in Azerbaijan was just USD 7,805mn as at Jan-2015. In 2015, USD 1,347mn increase of credit and loan were observed, but the number became almost 0 in 2016, meaning foreign investors may have become more cautious for providing loan to Azerbaijan. On net acquisition side of Financial Account, you can see increasing foreign investment amount till 2015, followed by rapid declining upon oil price slump. And USD 11bn of Reserve decline happened in 2015. The difficulty of Azerbaijan is that currency depreciation does not help recovery of Current Account, as 90%+ of export is from oil & gas, where price is determined by market price and settlement is held by USD, meaning currency depreciation has minimal impact on oil & gas export. MONETARY CONDITION Growing Non-Oil Current Account deficit worked as continuous sell-AZN / buy-USD pressure. On oil price declining phase, oil revenue contribution to SOFAZ, i.e. SOFAZ’s transfer to State Budget (buy-AZN / sell-USD), rapidly declined with faster pace than import shrinking. This unbalanced exchange dynamics raised pressure for sell-AZN. CBAR had nothing to do, as they ran out of their reserve at 2015. Following chart is deposit balance of financial institutions by currency type (AZN deposit vs. Foreign currency deposit). From middle of 2014 when crude oil price started declining, you can see accelerated increase of foreign currency deposit, reflecting rising concern for AZN. From beginning 2015 when first AZN depreciation was held, AZN deposit showed steep declining, on the other hand foreign currency deposit was rapidly increased and peaked at April 2015. Looks like people / companies in Azerbaijan rushed into converting AZN deposit / cash into foreign currency at that time. After April 2015, even foreign currency deposit started declining. Assume this reflects capital flight toward outside Azerbaijan, which is described at Balance of Payment section. From middle of 2017, AZN deposit has turned into increasing trend, reflecting stabilized exchange rate. Note that Foreign currency deposit is still under modest declining trend. Looks like financial companies are reducing foreign currency deposit, but detail is unavailable. 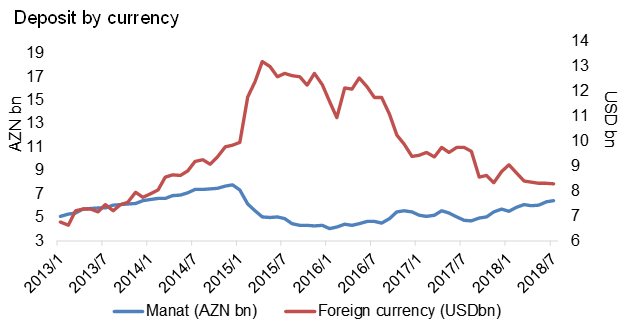 Following chart is CBAR’s exchange operation. From 2014, CBAR held total USD 19bn of net foreign currency sale, i.e. AZN-buy. The chart suggests CBAR had held foreign currency sale operation even before oil price slump. Why?? 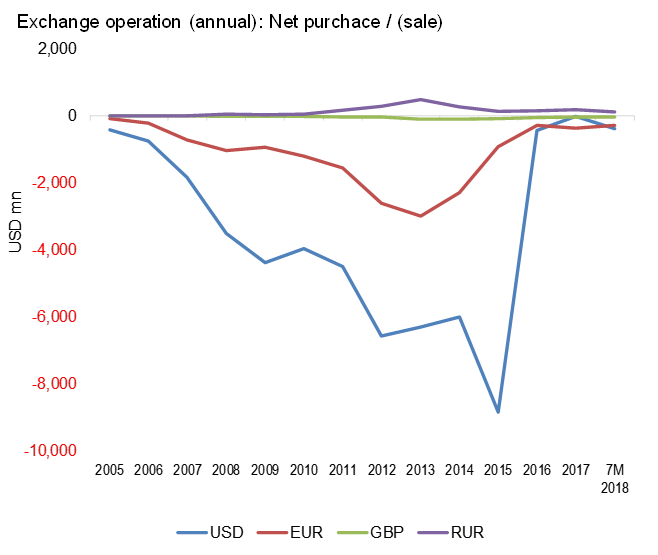 My understanding is that AZN is always under sale pressure regardless of oil price, I mean Azerbaijan’s foreign trade is separated into 2 worlds: Non-oil world (AZN/USD-conversion) & Oil world (USD). Non-oil world highly relies on import, where settlement is done by USD, which is sourced by sell-AZN / buy-USD. So, as non-oil import grows especially after 2011, sale pressure to AZN was increased. In oil world, project finance is provided through USD loan/bond. Revenue is USD-denominated. Payment to international service / engineering providers are USD-base. Debt services is by USD. This is a closed economy with limited interaction with Non-oil world. Based on Production Sharing Agreement (PSA), large portion of oil sales is contributed to SOFAZ and the amount is transferred mainly to State Budget, and also to CBAR and other oil/state projects. I guess this “transfer to State Budget” is the point where USD oil world meets with AZN non-oil world, I mean buy-AZN / sell-USD transaction is held through the transfer and AZN-based state budget is injected into non-oil economy. (Additionally, some USD portion should be transferred from oil-sector to government as tax) Let’s see the balance of these factors and relationship with CBAR’s exchange operation. 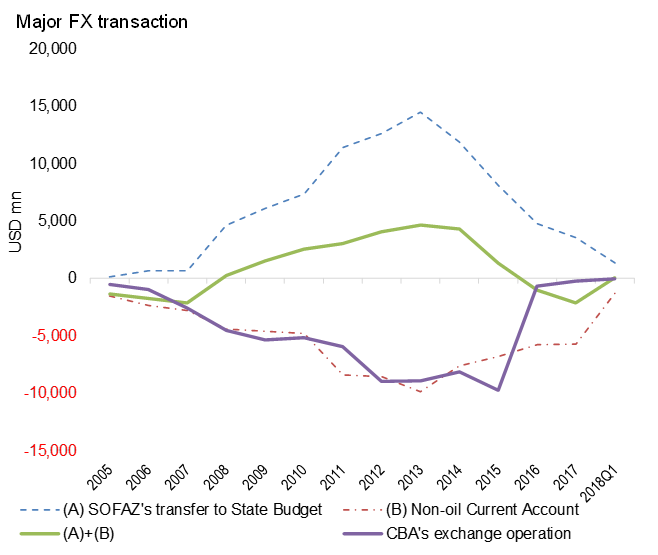 Blue dot-line (A), SOFAZ’s transfer to State Budget (buy-AZN / sell-USD), showed a strong growth from 2007 and reached USD 14.5bn at 2013, followed by rapid declining to just USD 3.6bn at 2017. Looks like the transfer amount is entering into increasing phase from 2018 (USD 1.3bn at Q1 2018) upon oil price recovery. Red dot-line (B) is Non-Oil Current Account (sell-AZN / buy-USD). As economy grew, Non-Oil Current Account deficit increased to USD 9.8bn at 2013, followed by gradual reduction of the deficit. Looks like Azerbaijan took an effort to reduce Non-Oil Current Account deficit from 2014, but the reduction pace was far slower compared to declining of (A). Green line is sum of (A) and (B). The amount entered into rapid declining phased from 2015 and entered into negative range from 2016. Purple line is CBAR’s exchange operation (buy-AZN / sell-USD). Until 2014, the operation was just to cover (B) Non-Oil Current Account deficit. As mentioned at Balance of Payment section, CBAR’s foreign currency reserve kept sufficient level until this timing (USD 13,758 at 2014). In 2015, (A) SOFAZ’s transfer to State Budget was drastically reduced due to oil price slump. Given the increasing concern, capital flight and reduction of AZN deposit were raised. Because of the increasing AZN-sell pressure from Current Account, Financial Account and domestic deposit dynamics, finally first AZN depreciation was held at February 2015, when CBAR had largest AZN-buy / USD-sell operation. CBAR’s reserve was reduced to USD 5bn level in 2015, and from 2016 CBAR seems to have given up the operation due to lack of fire power. Azerbaijan entered into further depreciation phases from 2016. 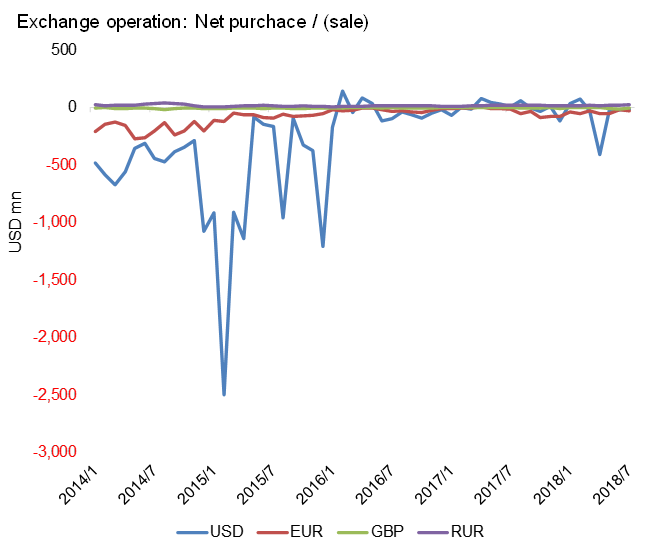 I personally think softer landing was possible on that situation. SOFAZ had USD 30bn+ financial asset and CBAR claims the SOFAZ’s asset is part of reserve. So, transferring part of the SOFAZ’s asset to CBAR reserve / depositing to commercial banks could have eased concern for AZN / economy and should have enabled more modest depreciation. However, this country took the option to protect SOFAZ asset and sacrifice people’s life. Following chart describes the money flow from oil export to governments. Based on Production Sharing Agreement (PSA), part of oil revenue is contributed to SOFAZ. The allocation ratio is defined by Real Rate of Return of profit oil portion. In a nutshell, the higher oil price is, the more allocation ratio to SOFAZ. The lower oil price is, the lower allocation ratio to SOFAZ. While oil price exceeded USD100/barrel, allocation to SOFAZ was 75-80%, followed by declining to 40-65% when the price was USD40-55/barrel. Due to this contract structure, money inflow to SOFAZ was rapidly decreased when oil price was declined. Thus, (A) SOFAZ’s transfer to State Budget was also declined rapidly. 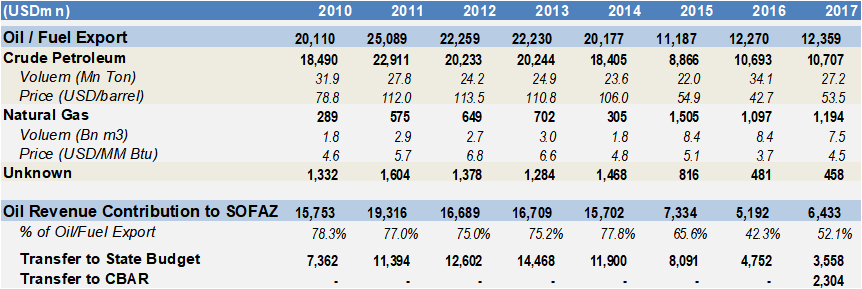 Now, let’s have a look at other monetary indicators quickly. Following chart is External Public Debt balance and ratio to GDP. The latest balance is USD 9.6bn or 23% of GDP. 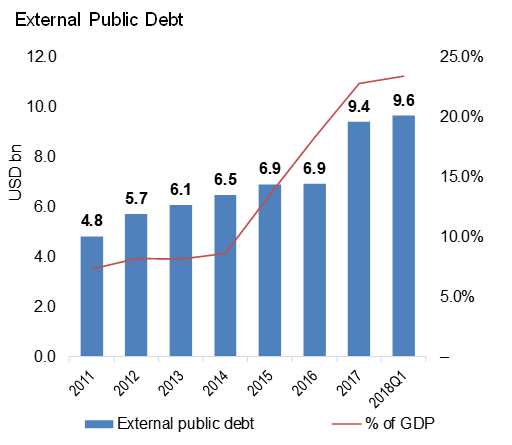 Below chart is money aggregate. Upon AZN depreciation at 2015, steep reduction of M1/M2 is observed. This reduced AZN liquidity pressures economic condition. 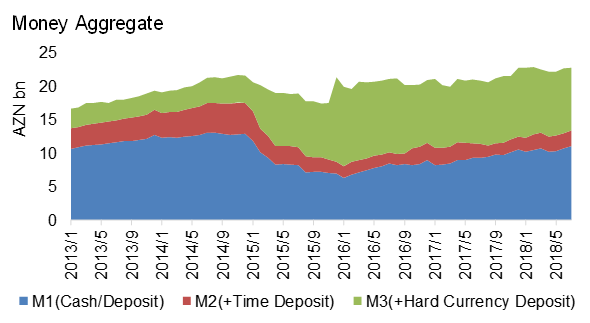 Following chart is loan provided to economy. Foreign banks are reducing loan exposure to Azerbaijan. State owned banks who provided money at currency crisis phase are also reducing loan balance. International Bank of Azerbaijan’s default may be related. Local private banks shows increasing presence. 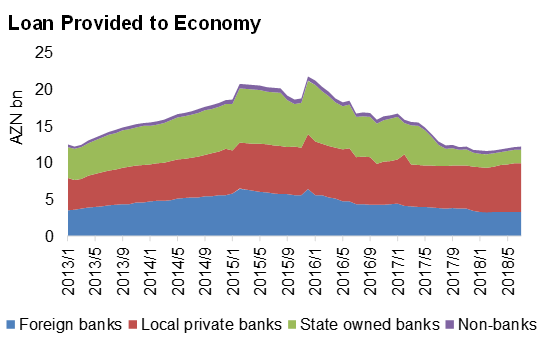 Floating Manat Rate From 2020 Risk of strengthened capital flight from mid/later 2019 and further depreciation at that timing. Azerbaijan plans a transition to floating manat regime by 2020. An expert said USD/AZN rate will be further depreciated to 2.5 level upon implementation of floating system. (http://azeridaily.com/economy/40175) Not sure how the 2.5 was computed, but just forget the theoretical 2.5 number. No one acts based on theory. The key implications are:
So, now AZN is promised to be depreciated from 2020. Who keeps such currency in their wallet?? I guess from mid or late 2019, people will notice the risk of coming AZN depreciation and domestic / international capital flight from AZN will be strengthened again. At that timing (before implementation of floating regime), we have to expect a risk of further AZN depreciation triggered as a transition phase to full floating system. If any small-scale depreciation is held for bailout of non-oil export industry, the above capital flight may start at earlier timing. |
